2015年南通市国民经济和社会发展统计公报①
南通市统计局
(2016年3月16日)
2015 Nantong Statistical Bulletin
of National Economy and
Social Development
Statistical Bureau of Nantong Municipal People’s Government
March 16, 2016
In 2015, the city of Nantong fully implemented the guidelines of the 18th CPC Congress, the 3rd, 4th and 5th plenary sessions of the 18th CPC Committee, in the spirit of General Secretary Xi Jinping’s important speeches during his visit in Jiangsu Province. The city proactively adapts itself to the new normal with in-depth understanding and takes the lead in realizing new normal. Under the guidance of Jiangsu Provincial Committee and Provincial Government, the city focused on “becoming two pioneers” and pressed ahead with “Eight Projects” and “Eight Leads”. The city seized opportunity and tackled with challenges to coordinate economic, political, cultural, social, ecological development and Party building. Accordingly, national economy has kept growing stably in a reasonable range. The quality and status of economic growth has been further ameliorated. Transformation and upgrading has gendered results with positive elements accumulating. Admittedly, the macro environment remains complex and severe, and the downward pressure still exists.
2015年,全市上下全面贯彻党的十八大和十八届三中、四中、五中全会精神,认真落实习近平总书记系列讲话特别是视察江苏重要讲话精神,主动认识新常态,积极适应新常态,奋力引领新常态,在省委、省政府的正确领导下,紧紧围绕“两个率先”,全力落实“八项工程”、实现“八个领先”,抢抓机遇、应对挑战,统筹推进经济、政治、文化、社会、生态文明建设和党的建设。国民经济总体处于稳健运行的合理区间,发展质态继续优化,转型升级成效显现,积极因素不断积累。但宏观环境仍然复杂严峻,下行压力不减。
一、综合
年末全市常住人口730.0万人,其中,城镇人口达到458.2万人,增长2.7%,城镇化率62.8%,比上年提高1.7个百分点。年末户籍人口766.8万人,比上年减少0.86万人。全市人口出生率7.60‰,人口死亡率8.98‰,人口自然增长率-1.38‰。
1. General Outlook
At the end of 2015, the city’s permanent population reached 7.300 million. The urban population was 4.582 million, with 2.7% increase. The urbanization rete was 62.8%, 1.7 percentage points higher than the previous year. The registered population was 7.668 million, an decrease of 8,600 over that of 2014. The birth rate of the city was 7.60‰ and the death rate was 8.98‰, rendering a natural population growth rate of -1.38‰.
|
2015年末人口数及构成 |
||
|
|
||
|
指 标 |
年末数(万人) |
比重(%) |
|
年末常住人口 |
730.00
|
— |
|
城镇人口 |
458.15
|
62.8 |
|
乡村人口 |
271.85
|
37.2 |
|
年末户籍人口 |
766.77
|
— |
|
#18岁以下 |
89.16
|
11.6 |
|
18-35岁 |
150.01
|
19.6 |
|
35-60岁 |
319.89
|
41.7 |
|
60岁以上 |
207.70
|
27.1 |
|
#男性人口 |
377.56
|
49.2 |
|
女性人口 |
389.21
|
50.8 |
|
Population and Its
Composition at the End of 2015 |
||
|
|
||
|
Item |
Year-end Population |
Proportion |
|
Permanent Population at the
Year-end |
730.00
|
— |
|
Urban |
458.15
|
62.8 |
|
Rural |
271.85
|
37.2 |
|
Registered Population at the
Year-end |
766.77
|
— |
|
#Age under 18 |
89.16
|
11.6 |
|
Aged 18-35 |
150.01
|
19.6 |
|
Aged 35-60 |
319.89
|
41.7 |
|
Aged above 60 |
207.70
|
27.1 |
|
#Male |
377.56
|
49.2 |
|
Female |
389.21
|
50.8 |
国民经济平稳增长。初步核算,全市实现生产总值②6148.4亿元,按可比价格计算,比上年增长9.6%。其中:第一产业增加值354.9亿元,增长2.9%;第二产业增加值2977.5亿元,增长9.7%;第三产业增加值2816.0亿元,增长10.5%。人均GDP达到84236元。按2015年平均汇率计算,人均GDP为13525美元,增长8.1%。
National economy kept stable grown in 2015. Based on the preliminary accounting, the GDP of the whole city② was 614.84 billion yuan, up by 9.6% over the previous year at comparable price. Of the total, the value of the primary industry was 35.49 billion yuan, up by 2.9%, the secondary industry 297.75 billion yuan, up by 9.7%, and the tertiary industry 281.60 billion yuan, up by 10.5%. The per capita GDP reached 84,236 yuan. According to 2015 average exchange rate, the per capita GDP registered 13,525 dollars, increasing by 8.1%.
2005-2015 Gross Regional Product (GRP)
Unit:100 miilion yuan
财政收入较快增长。全市实现一般公共预算收入625.6亿元,增长13.8%,其中,税收收入521.1亿元,增长13.9%,税收占比达到83.3%,比上年同期提高0.1个百分点。地方公共财政预算收入占地区生产总值的比重达10.2%,比上年提高0.5个百分点。
The fiscal revenue grew comparatively fast in 2015. The general public budgetary revenue reached 62.56 billion yuan, up by 13.8%. The total fiscal revenue accounted for 52.11 billion yuan, up by 13.9%, taking up 83.3% of the total, 0.1 percentage point higher over a year earlier. The local public fiscal budgetary revenue accounted for 10.2% of GRP, 0.5 percentage point higher over the previous year.
2005-2015 General Public Budgetary Income

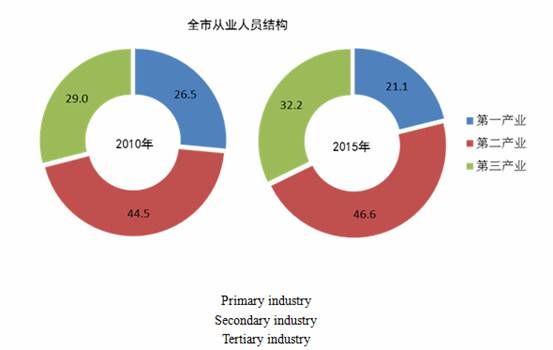
就业持续增加。全年新增城镇就业人数8.24万人,新增转移农村劳动力2.63万人。全年提供就业岗位35.9万个。年末从业人员达460.0万人,其中,第一产业97.2万人,第二产业214.5万人,第三产业148.3万人。
The employment keeps increasing. 82,400 urban working opportunities have been provided throughout the year and 26,300 rural labor forces had been lately transferred. In 2015, 35,900 jobs were offered. At the end of 2015, the number of employed people reached 4.60 million, 972,000 of which were for the primary industry, 2.145 million for the secondary industry and 1.483 million for the tertiary industry.
Composition of the Whole City’s Employment
劳动生产率稳步提高。全年全员劳动生产率③为127595元/人,比上年提高10.5%。
The labor productivity increased steadily. The all labor productivity③ was 127,595 yuan/person, 10.5% higher than that in 2014.
2010-2015 Nantong’s All Labor Productivity
Unit: yuan/ person
产业结构继续优化。全市三次产业结构演进为5.8:48.4:45.8。全年实现服务业增加值2816.0亿元,增长10.5%,占GDP比重达到45.8%。“两新”产业较快发展,完成高新技术产业④产值6202.5亿元,增长14.6%,占规模以上工业比重达到45.0%,同比提高1.4个百分点。六大新兴产业⑤完成产值4552.4亿元,增长10.6%,占规模以上工业的比重达到33.1%,与上年持平。
The industrial structure continued to be optimized. The three-industry structure evolved into 5.8:48.4:45.8. All year round, the service industry added value registered 281.60 billion yuan, up by 10.5%, accounting for 45.8% of GDP. “Two New” industries, namely hi-tech and emerging industries kept developing at a relatively high speed. As for the hi-tech industry④, the output reached 620.25 billion yuan, up by 14.6%, accounting for 45.0% of all above-scale industries, with a year-on-year growth of 1.4 percentage point. As for the six emerging industries⑤, the output reached 455.24 billion yuan, up by 10.6%, accounting for 33.1% of all above-scale industries, on par with that of the previous year
2010-2015 Three-tier Industrial Structure
Primary industry
Secondary industry
Tertiary industry
区域经济协调发展。县区实现生产总值3883.8亿元,增长9.9%,快于市区增幅0.4个百分点;完成一般公共预算收入353.0亿元,增长14.8%,快于市区增幅2.4个百分点,在工业应税销售收入、服务业应税销售收入、固定资产投资、社会消费品零售总额等指标方面,县区增速也快于市区。
The coordinated development of regional economy was maintained. The GDP of counties was 388.38 billion yuan, up by 9.9%, 0.4 percentage point higher than that of city proper. General public budgetary income registered 35.30 billion yuan, growing by 14.8%, 2.4 percentage points higher that of urban area. As for indicators of industrial taxable sales revenue, service industrial taxable sales revenue, fixed asset investment and total social consumer goods retail sales, the growth rate in counties is also higher than that of city proper.
全年新登记私营企业2.18万家,年末累计达17.3万家;新登记私营企业注册资本1674.2亿元,年末累计注册资本7813.5亿元。全年新登记个体户5.52万户,年末累计达46.8万户;新登记个体工商户资金数额58.1亿元,年末累计资金数额288.1亿元。年末全市共有规模以上民营工业企业3780家,占全市规模以上工业企业总数的比重达74.7%;全年民营工业增加值1800.6亿元,增长13.1%,占全市规模以上工业的比重达62.0%。
There were 21,800 newly-registered private enterprises of the whole year and total number was 173,000 at the end of the year. The whole year’s registered capital of the newly-registered private enterprises was 167.42 billion yuan, and the year-end accumulative total was 781.35 billion yuan. There were 55,200 newly-registered individual households of the whole year and the total number reached 468,000 at the end of the year. The registered capital of the newly-registered individual households was 5.81 billion yuan and the year-end accumulative total was 28.81 billion yuan. By the end of the year, there were totally 3,780 above-scale private industrial enterprises, accounting for 74.7% of the whole city’s above-scale industrial enterprises. The yearly private industry added value was 180.06 billion yuan, increasing by 13.1%, accounting for 62.0% of total volume of the whole city’ industries above designated size.
二、人民生活和社会保障
城乡居民收入稳步增加。全体居民人均可支配收入⑥27584元,比上年增长8.9%,按常住地分,城镇居民人均可支配收入36291元,比上年增长8.7%;农村居民人均可支配收入17267元,比上年增长9.1%。
2. People’s Livelihood and Social Security
The income of urban and rural residents kept growing. The per capita disposable income of all residents⑥was 27,584 yuan, up by 8.9% than that of the previous year. According to permanent living areas, the per capita disposable income of urban residents was 36,291 yuan, up by 8.7% than in 2014, while that of rural residents was 17,267 yuan, up by 9.1%.
|
Composition of
Residents’ Income in 2015 |
||||||
|
2015年居民收支构成表 |
||||||
|
|
|
|
|
|
|
|
|
|
All Residents |
Urban Residents |
Rural Residents |
|||
|
Value |
Increase |
Value |
Increase |
Value |
Increase |
|
|
(yuan) |
(%) |
(yuan) |
(%) |
(yuan) |
(%) |
|
|
Per capita disposable income |
27584 |
8.9
|
36291 |
8.7
|
17267 |
9.1
|
|
Salary income |
16138 |
9.8
|
21230 |
10.0
|
10105 |
9.1
|
|
Net business income |
5275 |
5.9
|
6408 |
2.2
|
3933 |
13.9
|
|
Property income |
1762 |
12.6
|
2899 |
12.8
|
414 |
11.1
|
|
Transfer net income |
4409 |
7.7
|
5754 |
9.9
|
2815 |
2.9
|
|
Per capita living consumption
expenditure |
18358 |
7.9
|
23680 |
7.5
|
23680 |
7.5
|
|
Food, tobacco and wine |
5296 |
6.6
|
6794 |
6.2
|
6794 |
6.2
|
|
Clothing |
1236 |
4.7
|
1771 |
3.7
|
1771 |
3.7
|
|
Housing |
4147 |
7.7
|
5437 |
7.9
|
5437 |
7.9
|
|
Living supplies and
services |
1082 |
9.0
|
1398 |
9.0
|
1398 |
9.0
|
|
Transportation and
telecommunications |
2951 |
7.7
|
3478 |
6.4
|
3478 |
6.4
|
|
Education, cultural and
recreations |
1920 |
14.0
|
2575 |
13.4
|
2575 |
13.4
|
|
Health care |
1146 |
8.8
|
1535 |
7.4
|
1535 |
7.4
|
|
Other goods and services |
580 |
7.7
|
692 |
7.9
|
692 |
7.9
|
2005-2015 Urban Residents’ Per-capita Income (Unit: yuan)

2005-2015 Farmer’s Per-capita Income (Unit: yuan)

Notes: Figures in 2012 and before are farmers’ per-capita net income.
全体居民人均消费支出18358元,比上年增长7.9%,按常住地分,城镇居民人均消费支出23680元,增长7.5%;农村居民人均消费支出12052元,增长9.1%。年末,城镇居民家庭每百户拥有电冰箱109.6台,空调202.1台,移动电话249.5部,家用电脑98.4台,家用汽车53.1辆。农村居民家庭每百户拥有电冰箱104.3台,空调129.9台,移动电话242.7台,家用电脑59.2台。
The per capita consumer spending of all residents reached 18,358 yuan, up by 7.9% than in the previous year. According to permanent living areas, the per capita consumer spending of urban residents was 23,680 yuan, up by 7.5% than in 2014; while that of rural residents was 12,052 yuan, up by 9.1%. By the end of 2015, every 100 urban households possessed 109.6 refrigerators, 202.1 air-conditioners, 249.5 mobile phones, 98.4 PCs, 53.1 private cars. Every 100 rural households possessed 104.3 refrigerators, 129.9 air-conditioners, 242.7 mobile phones, 59.2 PCs.
年末全市城镇居民人均住房建筑面积47.3平方米,比上年增长4.0%。农村居民人均住房面积59.3平方米,比上年下降8.1%。
At the end of 2015, the per capita housing construction area was 47.3 ㎡ for urban residents, up by 4.0% than in the previous year. The per capita housing area was 59.3 ㎡ for rural residents, decreasing by 8.1% than in the previous year.
市区居民消费价格总指数101.8,物价总水平比上年增长1.8%,其中,服务项目价格上涨2.6%,消费品价格上涨1.4%。八大类消费价格呈现“七涨一降”的态势。
The urban residents’ consumer price index was 101.8, which indicated that the general price level increased by 1.8% than in the previous year, among which the price of services rose for 2.6% and the price of consumer goods rose for 1.4%. Eight categories of consumer prices presented the situation of “7 rises and 1 fall”.
|
Urban Residents’
Consumer Price Index |
|
|
|
|
|
Item |
Increase than the |
|
Food |
2.8 |
|
Of which:Grain |
3.1 |
|
Meat, poultry and other products |
5.1 |
|
Egg |
-7.2 |
|
Tobacco, liquor and
articles |
2.5 |
|
Clothing |
2.3 |
|
Household appliances
and maintenance services |
3.2 |
|
Health care and
personal articles |
1.1 |
|
Transportation and
communications |
-3.5 |
|
Entertainment,
education and culture products and services |
2.4 |
|
Housing⑦ |
2.1 |
2015 Monthly Residents’ Consumer Price Index
Current Month(%) Accumulation(%)
年末全市参加城镇职工基本养老保险人数146.9万,较上年增加4.4万人。全市城镇职工基本养老保险离退休人数57.2万人,较上年增加3.2万人。城乡居民养老保险参保人数158.9万;参加失业保险人数100.76万人,比上年末增加2.06万人;参加基本医疗保险人数(在职)达183万人,比上年末增加6.29万人;参加工伤保险人数为126.84万人,比上年末增加4.63万人。
At the end of 2015, 1.469 million people attended the basic pension insurance, 44,000 more than that at the end of the previous year. Number of retirees enjoying urban employee’s basic pension reached 572,000, an increase of 32, 000. 1.589 million people joined urban and rural residents’ pension insurance. 1.0076 million people attended the unemployment insurance, 20,600 more than the previous year. 1.83 million people attended the basic medical insurance (in service), an increase of 62,900. At the end of the year, 1.2684 million people attended the employment injury insurance, an increase of 46,300.
年末全市拥有各类养老机构239家,床位数42357张,其中,农村敬老院96家,床位22438张。全市拥有养老床位总数(含社区养老)65161张。年末农村五保对象20886名,集中供养10374人,农村五保集中供养能力达到107.4%。全年结婚登记63564对。
At the end of 2015, there were 239 nursing institutions for the aged of various kinds with 42,357 beds in total, among which there are 96 nursing homes in rural areas with 22,438 beds. The whole city’s nursing beds for the aged amounted to 65161 (including those in community). The year-end number of rural people who enjoyed the “five guarantees” was 20,886, among which 10,374 were taken care intensively. The nursing capacity of “five guarantees” group reached 107.4%. 63,564 couples registered for marriage of the whole year.
三、农林牧渔业
3. Agriculture, Forestry, Husbandry and Fishing Industries
全市农林牧渔业总产值664.2亿元,按可比价计算,增长3.8%。其中,农业产值290.6亿元,增长2.9%;牧业产值150.2亿元,增长1.7%;渔业产值156.6亿元,增长4.6%。全年粮食亩产434.9公斤,增长0.7% 。
The total output value of the whole city’s agriculture, stockbreeding and fishery was 66.42 billion yuan at comparable price, up by 3.8%. Thereinto, the output value of agriculture was 29.06 billion yuan, up by 2.9%; stockbreeding, 15.02 billion yuan, up by 1.7%; fishery, 15.66 billion yuan, up by 4.6%. The whole year’s grain output per mu reached 434.9 kilograms, up by 0.7%.
粮食播种面积775.31万亩,增长0.3 %;棉花种植面积47.9万亩,下降14.2%;油料种植面积182.4万亩,下降4.1%;蔬菜种植面积199.2万亩,增长7.0%。
The sown area of grains was 7.7531 million mu, with 0.3% increase. The sown area of cotton was 479,000 mu, with 14.2% decrease. The sown area of oil plants was 1.824 million mu, with 4.1decrease. The sown area of vegetable was 1.992 mllion mu, up by 7.0%.
|
Output of Main
Agricultural and Sideline Products |
|||
|
|
|
|
|
|
Product |
Unit |
Output |
Increase than the
previous year(%) |
|
Grain |
10,000 tons |
337.15
|
0.9
|
|
Cotton |
10,000 tons |
3.65
|
-16.4
|
|
Oil Plants |
10,000 tons |
38.66
|
-1.0
|
|
Silkworm Cocoon |
10,000 tons |
1.60
|
-20.0
|
|
Pigs in Stock |
10,000 |
265.22
|
-2.0
|
|
Pigs for Slaughter |
10,000 |
389.77
|
-1.3
|
|
Sheep in Stock |
10,000 |
221.01
|
-2.8
|
|
Sheep for slaughter |
10,000 |
273.98
|
-2.0
|
|
Poultry in Stock |
10,000 |
4659.14
|
-2.5
|
|
Poultry for
Slaughter |
10,000 |
10927.43
|
0.1
|
|
Poultry Egg |
10,000 |
44.74
|
-2.1
|
|
Aquatic Products |
10,000 |
90.00
|
2.0
|
四、工业和建筑业
4. Industry and Construction
全市规模以上工业⑧增加值2902.3亿元,增长10.7%,其中,轻重工业分别增长8.8%和11.7%。分经济类型看,国有企业下降12.5%,股份制企业增长12.3%,外商及港澳台投资企业增长8.0%。分行业看,全市工业九大行业呈现“二快四稳二缓一降”的态势,其中,机械业和电子信息业产值均增长15.1%;轻工食品业、化工医药业、纺织服装业和冶金业平稳增长,同比分别增长8.9%、8.8%、5.6%和5.6%;船舶海工业和能源电力业分别增长4.1%和0.2%;建材业下降1.1%。工业产值中,装备制造业产值6694.8亿元,增长11.1%,占全市规模以上工业总产值的比重达48.6%,比上年提高1.1个百分点。
The added value of industries above designated size of the whole city⑧ was 292.23 billion yuan, up by 10.7%. Thereinto, the light industry increased by 8.8% and the heavy industry 11.7%. In terms of ownership, the added value of state-owned enterprises went down by 12.5%, and that of share-holding industries increased by 12.3%, that of foreign, HK, Macao and Taiwan invested industries increased by 8.0%. Among the 9 industries of Nantong, 2 grew fast, 4 stably, 2 slowly and 1 downward. Thereinto, the output value of both machinery industry and electronic information industry grew by 15.1%; light industry including food, chemical engineering and pharmaceutical industry, textile and garment industry as well and metallurgic industry rose in a steady way, with year-on-year growth of 8.9%, 8.8&, 5.6% and 5.6% respectively; shipping and maritime industry and energy power industry grew by 4.1% and 0.2% respectively; construction industry decreased by 1.1%. In terms of industry output, the equipment manufacturing industry took up 669.48 billion yuan, up by 11.1%, accounting for 48.6% among the whole city’s total output value of industries above designated value, increasing by 1.1percentage point than the previous year.
全市规模以上工业主营业务收入13350亿元,增长8.1%;利税总额1635.5亿元,增长11.3%;利润总额1027.7亿元,增长10.2%。亏损企业亏损总额40.5亿元,增长26.4%。
The main business income of the whole city’s industries above designated size was 1.335 trillion yuan, up by 8.1%. The total tax and profit amount was 163.55 billion yuan, up by 11.3%. The total profit amount was 102.77 billion yuan, up by 10.2%. The total loss of loss-suffering enterprises was 4.05 billion yuan, increasing by 26.4%.
|
Output of Main
Industrial Products |
|||
|
|
|
|
|
|
Item |
Unit |
Output |
Increase than the |
|
Yarn |
10,000 tons |
63.49
|
-1.0
|
|
Cloth |
100 million meters |
33.71
|
2.7
|
|
Printed and Dyed Cloth |
100 million meters |
30.76
|
2.6
|
|
Clothing |
100 million |
7.66
|
1.0
|
|
Chemical Fiber |
10,000 tons |
132.25
|
9.3
|
|
Metal Container |
10,000 m³ |
326.27
|
-22.5
|
|
Electric Portable Tools |
10,000 sets |
9703.39
|
5.6
|
|
Civil Steel Boats |
10,000 deadweight
ton |
438.52
|
-10.0
|
|
Ocean Engineering and Special
Boats |
10,000 comprehensive
ton |
803.05
|
-13.3
|
|
Communication and Electronic
Network Cable |
10,000 pair km |
7.91
|
-10.3
|
|
Optical Cable |
10,000 core km |
906.07
|
7.8
|
|
Semiconductor Discrete Devices |
100 million |
73.74
|
-7.9
|
|
Integrated Circuit |
100 million |
116.44
|
17.2
|
|
Power Generation |
100 million KWH |
396.28
|
-2.0
|
|
Of Which:Wind Power
Generation |
100 million KWH |
23.11
|
-8.5
|
规模以上工业企业中,七大高耗能行业产值增长4.8%,占规模以上工业产值比重为30.3%,同比下降1.2个百分点。初步核算,全市能源消费总量2660.17万吨标准煤,万元地区生产总值能耗⑨为0.452 吨标准煤,比上年下降5.31%。
Among above-scale industries, the output of seven energy-intensive industries increased by 4.8%. It took up 30.3% of the totality, with a year-on-year decrease of 1.2 percentage points. According to preliminary calculation, the whole city’s energy consumption equaled 26.6017 million tons of standard coal. The energy consumption for every 10,000 yuan GDP was 0.452 ton of standard coal, 5.31% decrease than the previous year.
|
Energy Consumption
of 10 Main Industries |
|||
|
|
|
|
|
|
Item |
Comprehensive |
Energy Consumption |
The Growth of Energy |
|
(10,000
tons of |
(tons
of standard |
(%) |
|
|
Electric and Heating Power
Generation and Supply Industries |
656.1
|
4.2012
|
2.7
|
|
Chemical Raw Material and
Chemical Products Manufacturing |
218.0
|
0.1132
|
-7.5
|
|
Textile |
133.7
|
0.0965
|
-7.8
|
|
Chemical Fiber Manufacturing |
69.7
|
0.2104
|
-7.5
|
|
Metal Product Industry |
55.5
|
0.0703
|
0.5
|
|
Electric Equipment and
Machinery Manufacturing |
48.2
|
0.0239
|
-6.4
|
|
Ferrous Metal Smelting and
Pressing |
36.2
|
0.1528
|
-4.7
|
|
Manufacture of Computers,
Communications and Other Electronic Device |
32.7
|
0.0396
|
-2.9
|
|
Non-metallic Mineral Product
Manufacturing |
29.0
|
0.0760
|
0.2
|
|
Electric and Heating Power
Generation and Supply Industries |
27.7
|
0.0492
|
-0.9
|
2015年,全市建筑业增加值526.2亿元,增长 10.4%。全市建筑⑩企业承建施工面积6.84亿平方米,增长0.3%。全市建筑队伍人数160万人,建筑队伍遍及35个国家和地区,年末出国人数0.79万人;年末全市拥有特级资质建筑企业15家,拥有一级建造师8685人。
In 2015, the added value of construction industry was 52.62 billion yuan, up by 10.4%. The construction area undertaken by enterprises was 684 million㎡, increasing by 0.3%. Of the whole city, there were 1.60 million people engaged in construction work, with teams extending to 35 countries and regions. At the end of the year, there were 7,900 workers abroad, 15 construction enterprises with premium quality and 8,685 first-grade constructors.
五、固定资产投资
5. Fixed Asset Investment
全市完成固定资产投资额⑪4376.0亿元,比上年增长12.3%,其中,民间投资3380.2亿元,增长16.8%,占固定资产投资的比重达77.2%,提高2.9个百分点;工业投资2223.8亿元,增长8.7%,其中技改投资1526.1亿元,增长25.0%,占工业投资的比重达到68.6%,比上年提高9.0个百分点。全市服务业投资达到2143.7亿元,增长16.5%。完成基础设施投资678.0亿元,增长8.9%。
The whole year’s fixed asset investment reached 437.60 billion yuan, 12.3% higher than that of the previous year. Thereinto, the private investment was 338.02 billion yuan with 16.8% increase and accounted for 77.2% of the total fixed-asset investment with 2.9 percentage points increase. The industrial investment was 222.38 billion yuan with 8.7% increase, 68.6% of which was 152.61 billion yuan investment in technological upgrading with 9.0 percentage points’ increase than the previous year and it grew by 25.0%. The city’s service industry investment reached 214.37 billion yuan, up by 16.5%. The whole year’s infrastructure investment added up to 67.80 billion yuan with 8.9% increase.
2005-2015 Fixed Assets Investment
交通枢纽加快建设。沪通长江大桥加快建设,宁启铁路复线电气化改造竣工试运营,宁启铁路二期开工建设;通洋高速一期建成通车,海启高速开工建设,锡通高速完成前期工作,形成“一环三射两通道”的高速公路网布局,实现高速公路县级节点全面通达;兴东机场一类航空开放口岸获批;连申线三级航道建成通航,九圩港复线船闸开工建设。
The city’s traffic hub construction has been accelerated. Hutong Yangtze River Bridge is being built steadily. Ningqi Railway double-track electrification reform was completed for trial operation and the second phase project was started. The first phase of Tongyang Expressway was opened for traffic. Haiqi Expressway project was started. Early-phase of Xitong Express was completed. The highway layout of “one ring, three redials, two passageways” was set up and covered all counties. Xingdong Airport first-class open port got approval. Lianshen grade three navigation channel was opened. Jiuyu Port double-track gate project was constructed.
全年房地产开发投资690.9亿元,增长1.8%。商品房施工面积5378.1万平方米,增长2%,其中,住宅施工面积3993.3万平方米,增长1.1%。全市商品房竣工面积1265.8万平方米,增长22.8%,其中,住宅竣工面积992.1万平方米,增长15.7%。商品房销售面积938.0万平方米,增长2.0%,其中住宅858.1万平方米,增长1.8%。
The whole year’s investment for real-estate development was 69.09 billion yuan with 1.8% increase. The construction area of commercial housing was 53.781 million㎡ with 2% increase, among which the residential construction area was 39.933 million ㎡ with 1.1% increase. The floor space completed for commercial housing was 12.658 million㎡ with 22.8% increase, of which the floor space completed for residential building was 9.921 million ㎡ with 15.7% increase. The sales area of commercial housing was 9.380 million ㎡ with 2.0% increase, of which there were 8.581 million ㎡ for residential building with 1.8% increase.
六、国内贸易和旅游业
6. Domestic Trade and Tourism
全年社会消费品零售总额2379.5亿元,增长9.9%。其中,城市消费品零售额1749.5亿元,增长10.1%;农村消费品零售额629.9亿元,增长9.1%。分行业看,批发和零售业消费品零售额2177.5亿元,增长9.8%;住宿和餐饮业消费品零售额202.0亿元,增长10.2%。
The whole year’s total social retail sales of consumer goods was 237.95 billion yuan with 9.9% increase, of which it was 174.95 billion yuan with 10.1% increase in urban area and 62.99 billion yuan with 9.1% increase in rural area. As for specific industry, it was 217.75 billion yuan with 9.8% increase for wholesale and retail sales industry and 20.20 billion yuan with 10.2% increase for accommodation and catering industry.
2005-2015 Social Retail Sales of Consumer Goods
Unit:100 million Yuan
限额以上贸易单位⑫商品零售额中,汽车类零售额比上年增长4.7%,石油及制品类增长2.5%,粮油食品类增长7.6%,烟酒类增长9.7%,服装鞋帽针织品类增长11.0%,日用品类下降3.7%,金银珠宝类下降5.6%,家用电器和音像器材类增长7.7%。
Of total retail sales of enterprises above designated size, the year-on-year growth of sales for motor vehicles was 4.7%, and that for petroleum and its products was 2.5%. There was 7.6% increase for grain, oil and food, 9.7% increase for beverage, tobacco and liquor and 11.0% increase for clothes, shoes, hats and knitwear, 3.7% drop for daily necessities, 5.6% decrease for gold, silver and jewelry, and 7.7% growth for household appliances and audio &video equipment.
全年接待海内外旅游者3404.5万人次,实现旅游总收入463.5亿元,分别增长10.4%和12.5%。其中,接待国内旅游者3387.2万人次,实现国内旅游收入453亿元,分别增长10.5%和13.1%;接待入境旅游者17.3万人次,同比下降7.6%,实现外汇收入11668万美元,增长8.1%。年末全市拥有旅游星级饭店86家,旅行社150家,A级旅游景区51处,省(市)级旅游度假区7个,星级乡村旅游点54个,全国农业旅游示范点2个,全国工农业旅游示范点7个。
As for the whole year, 34.045 million domestic and overseas tourists (person-times) had been received, gendering total income of 46.35 billion yuan, increasing by 10.4% and 12.5% respectively. Thereinto, 33.872 million domestic tourists (person-times) had been received, increasing by 10.5%. Domestic tourism income of 45.3 billion yuan was created, increasing by 13.1%. The number of in-bound tourists was 173,000 person-times, with a 7.6% year-on-year decrease. The foreign exchange earnings was 116.68 million USD with 8.1% increase. At the end of the year 2015, there were 86 star-rated tourist hotels, 150 travel agencies, 51 A-Level tourist attractions, 7 provincial(municipal)-level holiday resorts, 54 star-rated countryside tourist attractions, 2 national agricultural tourism model sites and 7 national agricultural and industrial tourism model sites.
七、开放型经济
全年进出口总值315.8亿美元,下降0.2%,其中,出口总值228.3亿美元,增长1.5%;进口总值87.5亿美元,下降4.5%。年末与我市建立进出口贸易关系的国家和地区209个。全市有5406家企业有进出口业务,增长6.9%。
7. Open Economy
The total value of goods import and export in 2015 reached 31.58 billion USD, falling off by 0.2% over the previous year. Of this total, the value of exported goods was 22.83 billion USD, up by 1.5%, and the value of imported goods reached 8.75 billion USD, down by 4.5%. At the end of the year, there were 209 countries and regions which developed import-export trade ties with Nantong. There were 5,406 enterprises with import and export performances, up by 6.9%.
2005-2015 Total Output of Exports
Unit: 100 million USD
|
Categorization of
Import &Export Modes and Export Market |
||
|
|
|
|
|
Item |
Volume |
Increase than the |
|
(100 million USD) |
||
|
进出口总值 |
315.79
|
-0.2
|
|
Total Value of Imports
&Exports |
87.53
|
-4.5
|
|
Import |
228.26
|
1.5
|
|
Export |
112.92
|
-4.1
|
|
#Joint-venture Enterprises |
109.26
|
9.6
|
|
Private Enterprises |
152.20
|
3.1
|
|
#General Trade |
70.21
|
-2.4
|
|
Processing
Trade |
66.15
|
-6.4
|
|
#Textile Products |
18.72
|
-4.7
|
|
Mechanical &Electrical
Products |
97.57
|
6.0
|
|
Hi-tech Products |
28.62
|
17.2
|
|
#Shipping &Marine Products |
23.53
|
-10.6
|
|
Photovoltaic
Products |
8.49
|
15.3
|
|
#Asia |
119.68
|
-2.7
|
|
#ASEAN |
34.68
|
5.8
|
|
Japan |
33.81
|
-10.0
|
|
Europe |
36.18
|
-10.3
|
|
#EU |
30.96
|
-10.9
|
|
North America |
36.55
|
9.1
|
|
#US |
34.07
|
9.7
|
全年新批外商投资项目315个,比上年增长2.6%,其中,千万美元以上项目168个,比上年增长3.7%;新批协议注册外资50.15亿美元,下降1.6%;实际到账注册外资23.16亿美元,增长0.5%。
There were 315 newly-approved foreign invested projects in 2015, 2.6% higher than the previous year. Thereinto, there were 168 projects over 10 million USD, a 3.7% increase. The newly-approved registered foreign capital with agreement reached 5.015 billion USD with 1.6% decrease. The paid-in registered foreign capital was 2.316 billion USD, up by 0.5%.
2005-2015 Actually Paid-in Registered Foreign Capital
Unit: 100 million USD
全年新批设立境外企业78家,中方协议投资额11.4亿美元。新签对外承包劳务合同额11.7亿美元,下降37.1%;完成对外承包劳务营业额24.4亿美元,增长7.6%;新派劳务人员1.42万人次,增长51.2%;年末在外劳务人员2.52万人,增长7.9%。
There were 78 newly approved and established overseas enterprises and domestic agreement investment reached 1.14 billion USD. As for newly-signed foreign contracted labor agreement, the amount was 1.17 billion USD with 37.1% decrease. As for the turnover of foreign contracted labor services, it was 2.44 billion USD with 7.6% increase. As for newly-assigned outsourcing laborers, there were 14,200 person-times, with 51.2% increase. There were 25,200 laborers aboard at the end of 2015, up by 7.9%.
八、交通、邮政电信业和电力业
8. Transportations, Post &Telecommunications and Power
Industry
全年交通运输、仓储及邮政业增加值220.3亿元,比上年增长3.1%。兴东国际机场陆续开通仁川、大阪、台北等3条国际(地区)航线,年末国内航线15条,开通周航班量110班,下降9.8%;完成旅客运输量突破百万人次,达到116.2万人次,增长24.6%;全年民航货邮吞吐量3.61万吨,增长13.3%。年末铁路南通站始发列车13对;全年铁路客运量257.5万人次,增长1.6%;货运量84.3万吨,下降7.5%。全年公路货运量111662万吨,增长3.4%;公路客运量9948万人次,下降0.5%。
Of the whole year, the added value of transportation, storage and post industries amounted to 22.03 billion yuan, up by 3.1% over the previous year. Xingdong International Airport opened airlines to Inchon, Osaka and Taipei this year. By the end of year 2015, there are 15 domestic airlines, 110 flights per week, descending by 9.8%. Passenger transportation volume has hit the record of 1 million person-times to 1.162 million person times, with 24.6% increase. The whole year’s civil air cargo throughput was 36,100 tons, up by 13.3%. At the end of 2015, there were 13 pairs of train departing from Nantong Station. The whole year’s railway passenger volume reached 2.575 million person-times, up by 1.6%; freight volume reached 843,000 tons, dropping by 7.5%. Freight volume of highway reached 1.11662 billion tons, up by 3.4%; passenger volume of highway reached 99.48 million person-times, falling off by 0.5%.
南通港全年货物吞吐量22077万吨,增长1.1%。其中,进港13043万吨,增长0.2%;外贸吞吐量5152万吨,增长7.0%。集装箱吞吐量75.9万标准箱,增长6.7%,其中,外贸航线31.3万标准箱,下降1.1%。
For Nantong Port, the whole year’s cargo throughput reached 220.77 million tons, up by 1.1%. Thereinto, inward cargo was 130.43 million tons, with 0.2% increase; throughput of foreign trade was 51.52 million tons, with 7.0% increase. Container throughput reached 759,000 standard containers, increasing by 6.7%, 313,000 of which were for international lines, decreasing by 1.1%.
年末全市机动车保有量194.95万辆,比上年末减少0.41万辆。其中,载客汽车108.51万辆,增加16.68万辆;载货汽车7.04万辆,增加0.05万辆;摩托车77.7万辆,减少17.08万辆。年末全市个人汽车保有量达102.84万辆,比上年末增加15.90万辆。
At the end of 2015, there were 1.9495 million motor vehicles of the whole city, 4,100 less than that at the end of 2014. Thereinto, there were 1.0851 passenger service vehicles, 166,800 more than in 2014; 70,400 trucks, 500 more than in 2014; 777,000 motor bicycles, 170,800 less than in 2014. The year-end number of private car was 1.0284 milion, 159,000 more than in 2014.
全年实现邮政业务收入28.6亿元,增长25.0%,电信业务收入62.64亿元,与上年基本持平。年末全市固定电话用户205.78万户,比上年减少26.31万户,其中,城市电话用户135.64万户,增加24万户;住宅电话用户157.35万户,减少21.53万户。年末移动电话用户934.07万户,净增142.69万户。年末互联网用户860.87万户,新增71.65万户,其中固定宽带互联网用户206.07万户,新增15.13万户,无线宽带互联网用户654.8万户,增加56.52万户。
The turnover of post and telecommunication services totaled 2.86 billion yuan, up by 25.0%. Telecommunications business income was 6.264 billion yuan, which is almost on par with that of year 2014. At the yearend, there were 2.0578 million fixed-phone users, 26,3100 less than the previous year. There were 1.3564 million urban fixed phone users, an increase of 240,000, and that of residential phones was 1.5735 million, 215,300 less than the previous year. The yearend mobile phone users reached to 9.3407 million, a net increase of 1.4269 million. At the end of the year, there were 8.6087 million internet users, an increase of 716,500, of which 2.0607 million subscribed fixed broadband internet, an increase of 151,300 and 6.548 million subscribed wireless broadband internet, an increase of 565,200.
全年用电量349.2亿千瓦时,增长4.8%。分产业看,第一产业用电量6.8亿千瓦时,增长12.5%;第二产业用电量258.2亿千瓦时,增长3.7%,其中,工业用电量253.1亿千瓦时,增长4.2%;第三产业用电量37.3亿千瓦时,增长7.6%。城乡居民生活用电量47.0亿千瓦时,增长7.5%。
In 2015, the power consumption was 34.92 billion KWH, up by 4.8%. Thereinto, the power construction for the primary industry accounted for 680 million KWH, up by 12.5%; 25.82 billion KWH for the secondary industry, up by 3.7%, among which industry power consumption reached 25.31 billion KWH, up by 4.2%; 3.73 billion KWH for the tertiary industry, up by 7.6%. The power consumption for urban and rural residents’ living was 4.70 billion KWH, 7.5% higher than the previous year.
全市拥有发电装机容量931.3万千瓦,其中燃煤火电厂装机670.4万千瓦,占全市总装机容量的72%,风力发电、光伏发电、生物质发电装机容量分别为148.4万千瓦、34.3万千瓦、3.7万千瓦,占全市总装机容量的比重分别为15.9%、3.7%、0.4%。
The city’s total installed power generation capacity was 9.313 million KW. Thereinto ,the coal fired power plant generated 6.704 million KW, accounting for 72% of the totality; for wind power, photovoltaic power and biological power, it was 1.484 million KW, 343,000 KW and 37,000 KW respectively, taking up 15.9%, 3.7% and 0.4% of the totality.
九、财政、金融
全年一般公共预算收入625.6亿元,增长13.8%,其中,增值税下降1.8%,营业税增长28.4%,企业所得税增长30.6%,契税下降7.6%。全年一般公共预算支出748.4亿元,增长15.2%。地方公共财政预算支出中,用于社会保障与就业、科学技术、教育、医疗卫生、环境保护等民生方面的财政投入达561.7亿元,占一般公共预算支出的比重达到75.0%,比上年提高1个百分点。
In 2015, the general public budgetary revenue was 62.56 billion yuan, increasing by 13.8%, among which added value tax decreased by 1.8% and turnover tax grew for 28.4%. Enterprise income tax grew by 30.6% and deed contact fell off by 7.6%. The whole year’s general public budgetary expenditure reached 74.84 billion yuan, up by 15.2%. 56.17 billion yuan of the local public financial budgetary expenditure was devoted into social security and employment, science &technology, education, medical health, environment protection and other fields of social wellbeing, accounting for 75.0% of the general public budgetary expenditure and increasing by 1 percentage point than the previous year.
全年金融机构新增本外币存款1242.7亿元,年末存款余额9843.4亿元,其中,储蓄存款余额5075.4亿元,比年初增长450.1亿元;非金融企业存款余额3101.5亿元,比年初增长523亿元。全年金融机构新增贷款822.4亿元,年末各项贷款余额6081.3亿元。
The whole year’s deposit increment of financial institutions was 124.27 billion yuan and the year-end deposit balance was 984.34 billion yuan. Thereinto, saving deposit balance was 507.54 billion yuan, with 45.01 billion yuan increase compared to the beginning of 2015; the saving deposit balance of non-financial enterprises was 310.15 billion yuan, with 52.3 billion yuan increase compared to the beginning of 2015. The whole year’s new loan of financial system was 82.24 billion yuan. At the year end, all loan balance was 608.13 billion yuan.
全年发放住房公积金贷款 56.1亿元,比上年增长27.5%;本年提取公积金53.6亿元,增长23.6%。全年新增公积金开户人数11.8万人,至年末已开户职工人数90.6万人。
For the whole year, 5.61 billion yuan of housing provident fund loans was released, with 27.5% increase. 5.36 billion yuan of housing provident fund was withdrawn, with 23.6% increase. There were 118,000 newly-opened accounts for housing fund and the total number had amounted to 906,000 by the end of 2015.
年末全市拥有保险机构75家,保险行业从业人员2.4万人。全年保费收入179.3亿元,比上年增长16.4%,其中,财产险收入54.5亿元,增长11.8%;人寿险收入104.2亿元,增长15.8%。全年已决赔款及给付72.6亿元,增长5.7%。
By the year-end, there were 75 insurance institutions with 24,000 employees. The whole year’s premium income was 17.93 billion yuan, increasing by 16.4% than the previous year. Thereinto, the property insurance income was 5.45 billion yuan, up by 11.8%; life insurance income was 10.42 billion yuan, increasing by 15.8%; settled claims and payments were 7.26 billion yuan, up by 5.7%.
年末全市上市公司32家,其中境内上市公司27家,比上年新增2家。上市公司通过首发、配股、增发、可转债、公司筹集资金598.7亿元,比上年增加141.7亿元。企业境内上市公司总股本170亿股,增长61.2%;市价总值3559.2亿元,增长152.2%。
The year-end number of listing companies was 32 and 27 were domestic listing ones, 2 more than that of the previous year. By IPO, share allotment, increasing stock issues, convertible bonds, listing companies have raised fund of 59.87 billion yuan, 14.17 billion yuan higher than year 2014. Domestic listing companies’ total equity amounted to 17 billion shares, with 61.2% increase. Total market capitalization reached to 355.92 billion yuan, with 152.2% increase.
十、科学技术和教育
10. Science &Technology and Education
年末全市拥有高新技术企业750家;新增省级高新技术产品836项;新建省级工程中心34家,省级企业院士工作站3家;新建市级工程技术研究中心74家,企业院士工作站1家。全年有24项科技成果获江苏省科技进步奖,其中,一等奖1项,二等奖3项,三等奖20项。年末,全市共建成科技孵化器50家,其中国家级9家、省级27家。全年专利申请量34770件,比上年增长25.6%;专利授权量25970件,增长109.6% ;其中,发明专利申请量8741件,增长3.4%,发明专利授权量2217件,增长137.9%,万人发明专利拥有量15.06件,增长30.6%。全社会研发投入占GDP的比重达到2.55%,比上年提高0.05个百分点。
By the end of 2015, there were 750 high-tech enterprises. There were 836 newly-added provincial-level high-tech products, 34 provincial-level engineering centers, 3 provincial-level enterprise academician workshop, 74 municipal-level engineering technology research centers, and 1 municipal-level enterprise academician workshop. For the whole year, 24 projects won Jiangsu science &technology advancement prizes, among which 1 won first prize, 3 won provincial second prize and 20 won third prize. By the end of the year, there had been 50 S&T incubators, including 9 state-level ones and 27 provincial-level ones. There were 34,770 patent applications, with 25.6% decrease than that of the previous year; 25,970 patent authorizations, with 109.6% year-on-year decrease. Thereinto, 8741 were invention patent applications, up by 3.4%; 2217 invention patents had been granted, up by 137.9%. Invention patents per 10,000 people numbered 15.06, increasing by 30.6%. The social expenditure on research accounted for 2.55% of GDP, 0.05 percentage point higher than the previous year.
全市拥有普通高等学校 8所,年末在校学生 9.0万人;成人高校 2所,在校学生 2.29万人;中等职业教育学校20所,在校学生6.16万人;普通高中 49所,在校学生 8.3万人;普通初中162 所,在校学生 15.51万人;小学 322所,在校学生32.56万人;特殊教育学校 7所,在校学生0.1万人;各级各类幼儿园443所,在园儿童16.42 万人。
Of the whole city, there were 8 general institutes of higher education, with 90,000 students at the end of 2014; 2 adult colleges, with 22,900 students; 20 secondary vocational schools, with 61,600 students; 49 regular high schools, with 83,000 students; 162 regular junior secondary schools, with 155,100 students; 322 primary schools, with 325,600 students; 7 special schools, with 1,000 students; 443 kindergartens of various kinds, with 164,200 children.
十一、文化、卫生和体育
年末全市拥有文化馆9个,文化站97个,公共图书馆10个,“农家书屋”1614个。全市拥有博物馆(纪念馆)22个。市级以上文物保护单位91处,其中全国重点文物保护单位10处,省级文物保护单位22处。市级以上非物质文化遗产106项,其中国家级10项,省级53项。全市拥有广播电视台7座,年末数字电视用户228.98万户,有线电视数字化率达86.2%。全年共登记一般作品版权2.15万件。年末全市文化市场经营单位1226个,广播电视行业单位29个,印刷发行单位2013个。全市拥有文化产业示范园区(基地)37个,其中国家级2个,省级5个。市图书馆(少儿图书馆)新馆于10月1日正式开馆。
At the end of the year, there were 9 cultural centers, 97 cultural stations, 10 public libraries, 1,614 “farmer’s bookstores” in Nantong. The city boasted 22 museums (memorial halls). There were 91 above-city-level historical sites of protection, of which 10 are historical sites under state protection and 22 under provincial protection. There were 106 intangible cultural heritages above state level, 10 of which were at state level and 53 were at provincial level. There were 7 broadcast and TV stations, with 2.2898 million households subscribing digital TV service, and the cable TV penetration rate reached 86.2%. As for the whole year, 21,500 works were registered for general copyright. There were 1,226 enterprises in cultural market, 29 in TV and broadcasting industry and 2,013 enterprises engaged in printing and distribution. There were 37 cultural industry demonstrative parks (bases), 2 of which were at state level, 5 at provincial level. The new site of Nantong City Library (Children’s Library) was officially opened on October 1, 2015.
2015年末全市拥有卫生机构1597个(不含农村社区卫生服务站、村卫生室)。其中,医院、卫生院306个,妇幼保健院(所、站)7个,专科疾病防治院(所、站)3个。全市卫生机构床位数3.6万张,卫生技术人员4.1万人。其中,执业医师和执业助理医师1.68万人,注册护士1.67万人。全市拥有疾病预防控制中心(站)9个,卫生技术人员473人;卫生监督所8个,卫生技术人员259人;乡镇卫生院101个,床位0.73万张,卫生技术人员0.73万人。
The year-end number of health agencies citywide was 1,597 (exclusive of rural community health stations and town clinics), among which there were 306 hospitals and clinics, 7 maternity and child health care centers (agency or station), 3 specialized subject hospital for disease control and prevention. For the whole city, there were 36,000 health agency beds with 41,000 health workers, including 16,800 practicing and assistant physicians, 16,700 registered nurses. The city owned 9 centers for disease prevention with 473 health workers, 8 health inspection institutes with 259 health workers, 101 township hospitals with 7,300 beds and 7,300 health workers.
市区(不含通州区)共建成城市社区卫生服务中心22个,以街道(镇)为单位建成率100%。累计建成农村社区卫生服务站、村卫生室1551个,行政村覆盖率100%。全市新型农村合作医疗参合率99.91%。农村自来水普及率 100%。
There were 22 urban community health service centers in Nantong’s downtown are (Tongzhou District excluded), with 100% establishing rate, counting by the unit of sub-districts (township). 1,551 rural community health service stations and village clinics had been established in total with 100% coverage of administrative villages. The whole city’s participation rate of new rural cooperative medial health system was 99.91% and the rural tap water coverage rate was 100%.
全年成功承办6项次国际赛事、6项次全国赛事、7项次省级赛事。全市新增晨晚练健身点276个,各级各类全民健身活动参与群众超过10万人次。体育彩票全年实现销售额12.2亿元。
The city had undertaken 6 international competitions, 6 national ones and 7 provincial ones in 2015. There was an increment of 276 sites for morning and evening exercise citywide and a participation of more than 100,000 person-times into various fitness activities. The yearly sales of sports lottery reached 1.22 billion yuan.
十二、环境保护和安全生产
12. Environment Protection and Work Safety
全年市区(含通州区)新增绿地710公顷,城市绿化覆盖率42.8%;日供水能力达到160万立方米,水质综合指标合格率100%;市区燃气普及率、用水普及率、生活垃圾无害化处理率均达到100%。全年市区新增路灯、景观灯26395盏,城市道路亮灯率达到99.5%。
There were 710 hectares of new green space in the downtown area (Tongzhou District included), and the urban green coverage reached 42.8%. The daily water supply capacity was 1.6 million m³, and the pass rate of water quality comprehensive index was 100%. The downtown’s penetration rates of gas, tap water and innocuous disposal of domestic garbage all reached 100%. There was an increment of 26,395 road lamps and landscape lights in the downtown area of the whole year, and 99.5% of the urban roads were equipped with lights.
2015年全市共新建(改造)燃煤火电、热电机组脱硫设备5套、脱硝设施2套、完成7台超低排放火电热电机组改造,锅炉平均脱硫效率达80%以上、综合脱硝效率达60%以上,烟尘排放基本达到重点区域特别排放限值。全市各地根据实际划定了禁燃区范围。
In 2015, there were 5 sets of newly-built (transformed) coal-fired thermal power and thermoelectric desulfurizing equipment, 2 sets of denitration facilities, 7 sets of dust removing renovation equipment. The average desulfurizing efficiency of boilers reached above 80% and comprehensive denitration efficiency reached above 60%. The dust emission had been basically controlled within the special limit of key areas. There were “no-fly zones” set all around the city.
2015年全市环境质量保持稳定,环境空气主要污染物年平均值为:二氧化硫30微克/立方米,二氧化氮38微克/立方米,可吸入颗粒物88微克/立方米,PM2.5浓度为58微克/立方米,其中二氧化硫和二氧化氮年均值符合国家空气质量二级标准,可吸入颗粒物和PM2.5年均值超过国家空气质量二级标准;全年空气质量指数达到良好以上的天数达247天,占全年有效监测天数的67.7%。长江南通段主流水质符合国家地面水质环境质量Ⅲ类水质标准,饮用水源地水质达标率100%。区域环境噪声平均值为53.4分贝,交通干线噪声平均平均值为66.0分贝,均符合国家环境噪声质量标准。
The whole city’s environment quality kept stable. The yearly averages of main ambient air pollutants were 0.030 mg/ m³ for SO2, 0.038 mg/ m³ for NO2, 0.088 mg/ m³ for PM10 and 0.058 mg/ m³ for PM2.5. The annual averages of SO2and NO2 reached the national secondary level of air quality, while the annual averages of inhalable particles and PM2.5were above the national secondary level. There were 247 days with good air quality, accounting for 67.7% of the whole year. The mainstream water of Yangtze River in Nantong conformed to national ground water qualityⅢ standard and the drinking water sources were 100% qualified. The average of regional environment noise in urban area was 53.4 dB, and the average of artery traffic noise was 66.0 dB, both conforming to the national standard.
全年共发生各类安全生产事故1047起,死亡162人,比上年分别下降13.3%和1.2%,其中,工矿商贸企业(含建筑业)发生生产安全亡人事故19起,死亡21人。全市共发生火灾2939起,死亡12人,伤5人,受灾1414户,烧毁建筑面积3.1万平方米,直接财产损失949.9万元。全市共发生一般以上交通事故1284起,死亡432人,伤1187人。
There were 1,047 work safety accidents and 162 deaths, reducing by 13.3% and 1.2% respectively. Thereinto, there were 19 deadly cases with 21 deaths of industrial and mining business enterprises (including construction industry). In 2015, there were 2,939 fire accidents, causing 12 died, 5 injured, 1414 households affected, 31,000 m2 building area was burned and the direct economic loss reached 9.499 million yuan. For the whole city, there were 1,284 cases of above-average road traffic accidents, causing 432 died and 1,187 injured.
Notes:
① Data of 2015 released in this bulletin are quick statistic data. Due to the rounding-off, the subentries may not add up to the aggregate totals.
② Gross domestic product and absolute value added of all industries are calculated at current price and growth rates are calculated at constant price. Relevant data were revised according to the 3rd national economic census and the"Regulation on Classification of Three Sectors" promulgated by NBS in 2012.
③ All labor productivity is the ratio of GDP (calculated at 2010 constant price) to all working labors.
④ Hi-tech industrial output is calculated based on “The Notice on Releasing ‘Jiangsu High-tech Industrial Statistics Classified Catalogue’(2012 revised version)”(Jiangsu Hi-tech [2012] No. 332), including aircraft and spacecraft industry, electronic computer and office equipment industry, electronic and telecommunications industry, pharmaceutical industry, instrument and meter industry, intelligent equipment industry, and new material industry.
⑤ Emerging industries comprise new energy industry, new material industry, biological technology and new medicine manufacturing, intelligent equipment industry, energy saving and environment protection industry, as well as oceanic engineering equipment manufacturing.
⑥ Since the fourth quarter of 2012, NBS initiated innovation of urban-rural integration household survey, by making uniform standards for urban and rural residents’ income items, classification and statistics. 160,000 urban and rural households were selected for direct survey, based on which two types of data were attained—the comparable new caliber for all residents per capita disposable income and the separateurban and rural residents per capita disposable income. As for the number of durable consumer goodspossessed, it is incomparable to those of previous years as it was first collected after the urban-rural integration reforms.
⑦ Housing prices include those of construction, decoration, residential rents, owner occupied housing, as well as water, electricity and fuels.
⑧ Above-scale industrial statistics refer to industrial enterprises with annual main operation revenue of 20 million yuan and above.
⑨ General energy consumption for every 10,000 yuan GDP was calculated at 2010 fixed price
⑩ Statistics of construction industry refer to qualified construction enterprises
⑪ Statistics of fixed asset investment refer to construction projects with 5 million yuan total investment and above. Statistics of real estate refer to real estate development and operation enterprises.
⑫ As for statistics of retail sales of social consumer goods, above-designated units refer to whole-sale enterprises (units) with annual main business revenue of 20 million yuan and above, retail enterprises (units) with annual main business revenue of 5 million yuan and above, as well as accommodation and catering enterprises (units) with annual main business revenue of 2 million yuan and above.
Data resources: Statistics concerning urban and rural increased employment, registered unemployment rate, social security are from human resource and social security bureau; financial statistics from bureau of finance; financial credit data from people’s bank; installed power-generation capacity and power consumption data from power supply bureau; railway transportation from railway office; civil airline data from Xingdong International Airport; data of telephone, broadband and mobile internet users from economy and informatization commission; data of urban sewage processing, green rate of built area, urban construction from urban and rural construction bureau; cargo import and export data from the customs; data of foreign direct investment, outward foreign direct investment, overseas contracted project, exterior labor cooperation from bureau of commerce; data of household population, civil vehicle, traffic accident from bureau of public security; postal service data from bureau of post; tourist data from bureau of tourism; data of listing company from development and reform commission; data of insurance industry from insurance association; elderly care data from bureau of civil affairs; educational data from bureau of education; data related to science and technology and patent from science and technology bureau; data of artistic troupes, museums, public library and cultural center from bureau of culture; data of broadcasting and TV from bureau of press, publication, radio, film and TV; sports data from bureau of sports; health data from bureau of health; environment supervision data from bureau of environment; safety production data from bureau of safety supervision; data of grain production, urban and rural residents’ income and expenditure and price index from Nantong survey team; others from Nantong Bureau of Statistics.
注释:
①公报发布的2015年数据为初步统计数。部分数据因四舍五入的原因,存在着与分项合计不等的情况。
②国内生产总值、各产业增加值绝对数按现价计算,增长速度按不变价格计算;根据第三次全国经济普查结果和国家统计局2012年制定的《三次产业划分规定》对相关数据进行了修订。
③全员劳动生产率为国内生产总值(以2010年不变价格计算)与全部从业人员的比率。
④高新技术产业产值根据江苏省科技厅和江苏省统计局联合下发的《关于发布<江苏省高新技术产业统计分类目录>(2012修订版)的通知》(苏科高[2012]332号)进行统计,包括航空航天制造业、电子计算机及办公设备制造业、电子及通讯设备制造业、医药制造业、仪器仪表制造业、智能装备制造业、新材料制造业和新材料制造业。
⑤新兴产业包括新能源制造业、新材料制造业、生物技术和新医药制造业、智能装备制造业、节能环保制造业和海洋工程装备制造业。
⑥2012年四季度起,国家统计局实施了城乡一体化住户调查改革,统一了城乡居民收入名称、分类和统计标准,在全国统一选取了16万户城乡居民家庭,直接开展调查。在此基础上,计算了城乡可比的新口径全体居民人均可支配收入以及分城乡居民人均可支配收入。耐用消费品拥有量为城乡一体化改革后的调查数据,与以前年份不可比。
⑦居住类价格包括建房及装修材料、住房租金、自有住房和水电燃料等价格。
⑧规模以上工业统计范围为年主营业务收入2000万元及以上的工业企业。
⑨万元国内生产总值能耗按2010年不变价格计算。
⑩建筑业统计范围为有资质的建筑业企业。
⑪固定资产投资统计范围为计划总投资500万元及以上建设项目,房地产投资统计范围为房地产开发经营企业。
⑫社会消费品零售总额统计中限额以上单位是指年主营业务收入2000万元及以上的批发业企业(单位)、500万元及以上的零售业企业(单位)、200万元及以上的住宿和餐饮业企业(单位)。
数据来源:
本公报中城镇新增就业、登记失业率、社会保障数据来自人力资源社会保障局;财政数据来自财政局;金融信贷数据来自人民银行;发电装机容量、用电量来自供电局;铁路运输数据来自铁路办;公路运输数据来自交通局;港口货物吞吐量数据来自港口局;民航数据来自兴东国际机场;电话用户、宽带用户、移动互联网用户等数据来自经信委;城市污水处理、建成区绿地率、城建数据数据来自城乡建设局;货物进出口数据来自海关;外商直接投资、对外直接投资、对外承包工程、对外劳务合作等数据来自商务局;户籍人口、民用汽车、交通事故数据来自公安局;邮政业务数据来自邮政局;旅游数据来自旅游局;上市公司数据来自发改委;保险业数据来自保险协会;养老数据来自民政局;教育数据来自教育局;科技、专利等数据来自科技局;艺术表演团体、博物馆、公共图书馆、文化馆数据来自文化局;广播电视来自新闻出版广电总局;体育数据来自体育总局;卫生数据来自卫计委;环境监测数据来自环保局;安全生产数据来自安监局;粮食产量、城乡居民收支、物价指数等数据来自南通调查队;其他数据均来自市统计局。